Monday, July 28, 2014

Sources of Variation

Sources of variation can be categorized into two major categories. These are called common cause variation and special cause variation.
Common Cause Variation:
·        Present all the times in the process
·        Individually will have a minor effect
·        Collectively the variation can be added up leading to significant effect
Special Cause Variation:
·        Not always present in the process
·        Appear sporadically
·        Come from outside the process
·        Can have large or small affect on variation but typically have major impact

Strategy to address special cause:
·        Gather the data real time to signal the special causes quickly
·        Take immediate actions to reduce the damage
·        Investigate for the cause – Understand what is different
·        Plan for a long term solution
Strategies to address the common causes involves
·        Stratify – Identify the patterns in the way the data is clustered or do not clustered
·        Experiment – Make planned changes and learn from the effect
·        Disaggregate – Break the processes into small pieces and manage the pieces effectively

7 Step method of process improvement:
1.      Purpose
·         What are we trying to do?
·        What problem/gap is being addressed?
·        What is the impact?
·        What are the other reasons to fix this gap?
·        How to know things are better once improved?
·        What is your plan for this project?
2.      Current Situation
·        What is the history?
·        What are the symptoms of the problem?
·        Where do they appear?
·        What happens when the problem occurs?
·        Who is involved?
·        Can we draw the flowchart to depict the process?
3.      Cause Analysis
·        What are the causes for the symptoms?
·        Which can be verified using data?
·        What are the potential root causes?
4.      Solutions
·        What actions will address the root causes?
·        What criteria can be used to compare the solutions?
·        What are the pros and cons of each solution?
·        Which is the best? Which one will be selected?
·        How to test in a small scale? How to verify with data?
·        Which solution proved to be more effective?
·        What are the plans for full scale implementation?
5.      Results
·        How will the results meet the targets?
·        How well the plan executed?
·        How the results can be sustained in future?
6.      Standardization
·        What is the new standard method?
·        How will the users be trained?
·        What is in place to ensure the results are maintained?
·        How the results will be monitored?
·        What means are in place to foster ongoing improvements?
7.      Future plans
·        What is not addressed by this project?
·        What are the recommendations?
·        What is being learned from the project?
·        How the documentation will be finished?
·        What is the exit criterion to close the project?
·        Did we meet the exit criteria?


Consulting – Taguchi’s Loss function

Myth: Any outcome between the customer specification limits considered as equal form the customer perspective. For example customer queue time in a bank is between 15-30minutes, as per this myth the customer who is been served at 15 minutes and another customer at 30minutes is received the same quality from the bank perspective as both of them are service within the agree time.

Reality: The quality of service/ product will be of not equal from the customer/ society perspective as it goes away from the target value even though it is within the agreed specification limits.


Justification: Taguchi one of the well-known statistician / engineer developed a representation that measures the financial impact of loss to the society if the product/service deviates from the target value. The representation is termed as Taguchi’s Loss Function. In conventional methods the Cost of Quality is measured considering the number of products rejected or reworked. In this method it is difficult to differentiate the cost of quality if the two products properties are within the specification limits but vary from each other.


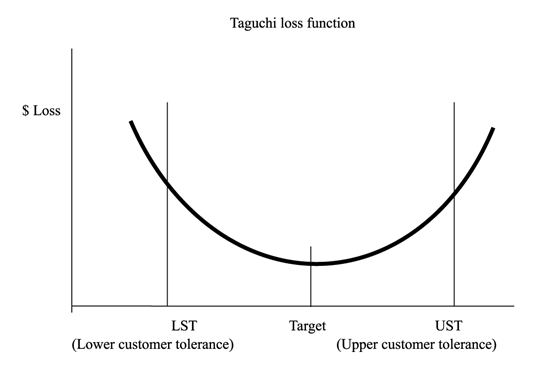
From Taguchi’s perspective the loss function is as below. The graph depicts the lross function as a deviation from the target value of a product parameter. The parameter could be a diameter, color, density, hardness any other critical parameter of a product. From the service perspective the parameter could be cycle time, communication, responsiveness etc.

UST – Upper Specification Tolerance, LST – Lower Specification Tolerance


Taguchi believes performance begins decreasing gradually as the design parameter deviates from the target value even though the parameter value is between the LST and UST. Therefore, Taguchi proposed that the loss function be measured by the deviation from the target value. The loss function is
L = K * (Y – M) ^ 2
·        L is the result value of the function, generally measured in monetary units
·        Y measured value
·        M target value
·        K is a loss coefficient (Convert into monetary values)

Example: A company produces a part that has a diameter of 0.5 inches + or - 0.01 inches of tolerance. Failure cost of a rejection is $45.00. There are 30 units produced and the actual diameter is as below. Calculate and compare the loss considering the convention method as well as Taguchi’s loss function method.


Tuesday, July 1, 2014

Six Sigma - Levels of Root Cause Analysis

It may not be necessary to spend equal efforts for any type of problem/issues. The kind of investigation may vary depending on the issue frequency/impact/nature. This articles details out the multiple level of Root Cause Analysis (RCA) that can be approached deepening on the problem nature.