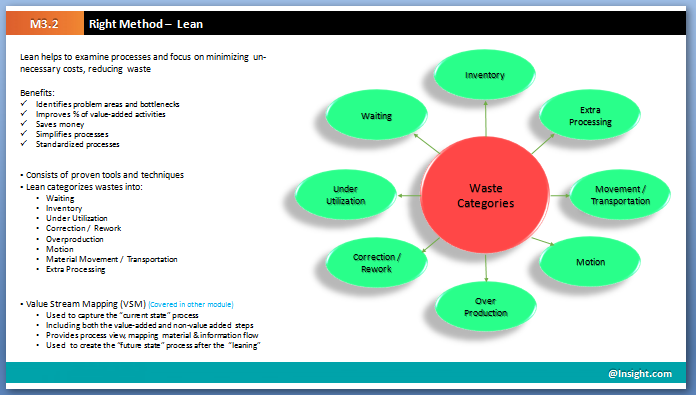
Below list
contains the list of tools used in Lean
· Value Stream Maps (VSM)
o
Visually map
the flow of production
o
Current and
future state of processes highlighting opportunities of improvement.
o
Exposes
waste in the current processes and provides a roadmap for future state
o
categorizes activities into three segments: value enabling, value
adding and non-value adding
o
Value enabling activities, however, cannot be totally eliminated
from a system
o
focus of this tool is on identifying and eliminating the non-value
added activities in each process step
·
Takt time
o
Takt time is
the rate at which a completed project needs to be finished in order to meet
customer demand
o
This is
the "heartbeat" of the customer
o
Takt =
T/D
§
Where T is
Time available for product/service.
§
D is a
demand for the number of units
§
T gives
information on production pace or units per hours
·
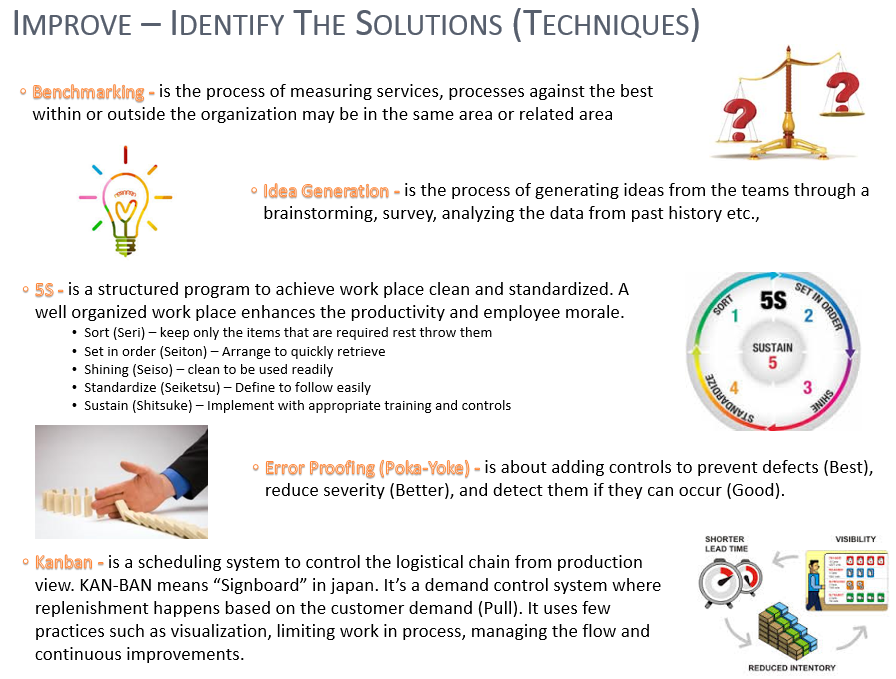
5S
o
Used to
organize the work area and eliminates the waste that results from poorly
organized work area.
§
Sort –
Eliminate that items that are needed
§
Set in order
– Organize the items that are needed
§
Shine –
clean the items
§
Standardize
– defined standard operating procedures
§
Sustain –
Regular compliance and improvement with respect to standards
·
Pull / Kanban
o
Regulating
the flow of goods using the signal cards as needed
o
Eliminates
inventory and overproduction
·
Spaghetti chart
o
Graphical
technique used mostly in lean manufacturing
o
Used to
display the actual flow/layout/material/machines and distances in a work
process
o
Poorly laid
out process work area that looks like a mass of cooked spaghetti
o
Used to
track work item flow, material flow and people flow
·
·
Poka – Yoke
o
Design the
process to detect, fix and prevent the defects as and when it happens
o
Cost of
fixing the defects increases exponentially as the work progresses and the
defects found in later stages than where they got injected
o
Also called
mistake proofing
·
SMED Single Minute Exchange of Die
o
Reduces the
time to Set up
o
Converting
the setup steps to external and simplifying the internal steps
o
Eliminating
non-essential steps and standardizing the work instructions
·
Total Productive Maintenance
o
A holistic
approach focuses on proactive and preventative
o
Empowering
operators to help maintain their equipment.
o
Shared
responsibility for equipment by plant floor workers
·
Heijunka
o
Production
scheduling that purposely manufactures in much smaller batches
o
System of
production designed to provide a more even and consistent flow of work
o
Reduces lead
times and inventory
·
Gemba
o
It’s a
philosophy that encourages to go to the work area and observe for any
opportunities than sitting in the closed cabins
o
Promotes
fist hand observations from the floor employees
·
Hoshin Kanri
o
Align
strategy (Top management) to tactics (middle management) to Actions (employees)
o
Continuity
towards goals by eliminating poor communication & improper direction
·
Jidoka
o
Design the
equipment’s to automate some part of the manufacturing process i.e. partial
automation is less costlier than full automation
o
Mainly focus
on avoiding/detecting and fixing defects quickly
·
Just in time (JIT)
o
Pull the
parts based on the customer demand instead of pushing the parts based on the
projections
o
Reduced the
inventory levels and reduces the space requirements
·
Kaizen
o
Regular and
incremental improvements
o
Participation
from all the employees