Showing posts with label Green Belt. Show all posts
Tuesday, September 23, 2014
Tuesday, July 1, 2014
Six Sigma - Levels of Root Cause Analysis
Labels:
Green Belt,
Improvements,
Lean,
RCA,
Six Sigma,
Statistics
Monday, June 30, 2014
Six Sigma – Root Cause Analysis (RCA)
Introduction: Beneath
every problem there is an underlying cause but we need to identify the root
cause to prevent the recurrence. Many times the actions taken to address the
issue reoccur again in the same place or in a different place. This symptom indicates
that the root cause is not been identified/addressed. Root Cause Analysis (RCA)
is a structured approach for identifying and eliminating the underlying root
causes. It may not be feasible or necessary to conduct RCA for all the issues
as it involves time and effort. RCA is an analytical tool to perform a
comprehensive, system-based review of critical incidents. Primary objectives of
RCA includes
·
The
primary aim is to identify the root cause(s) and prevent that problem from ever
recurring
·
Systematic
way of approaching and resolving the problem
·
Prevent
the recurrence at lowest cost in the simplest way
- Define the
problem
- Gather the
information
- Plan for
Root Cause Analysis
- Conduct RCA
- Develop the
solutions and action plans
- Manage the
Action items
Labels:
Consulting,
Green Belt,
Improvements,
Lean,
RCA,
Six Sigma,
Statistics
Six Sigma – Root Cause Analysis Techniques
Many techniques available in conducting Root
Cause Analysis, each technique has its own advantages and suitable for a
particular situation. Common, widely accepted and simple to use techniques
includes
·
Cause & Effect diagram
·
5-Why Analysis
·
Brainstorming
Cause &
Effect Diagram: Also
called as Fishbone diagram. This is a tool for identifying all the causes of an
effect. The effect being examined is the problem/opportunity that has to be
eliminated. C&E Diagram is a graphical representation of the causes and
effect. Use this technique for
·
Multiple causes has to be grouped logically
·
Understand width and depth of the causes
·
Problem is repetitive
Steps:
·
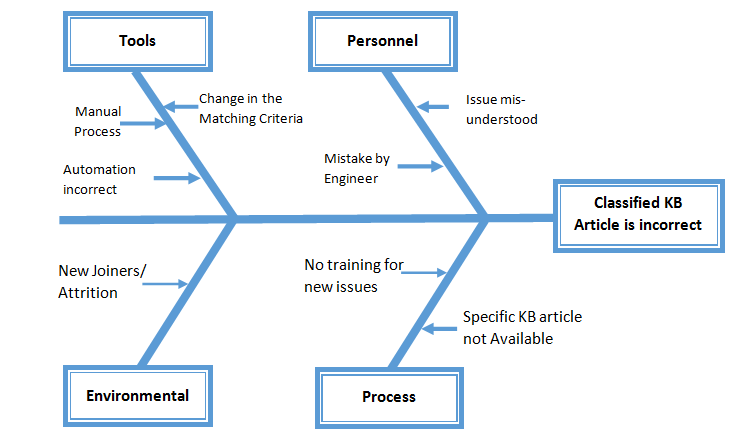
Write down the effect to be investigated and
draw the backbone arrow (as below)
Note: KB Article – Knowledge Base Article
has to be selected by the engineer to resolve an issue reported by the
customer. Selecting of wrong article either delays the resolution or
unnecessary escalation to a next level as the issue is unresolved by the engineer.
· Brainstorm with the identified people
considering all the broad areas/ groupings of the potential causes of the
effect “Classified KB article is incorrect”. Rule of thumb consider the generic
4 categories i.e., Man, Method, Material and Environment. You can define your
own categories and may use affinity diagram to group the cause.
·
Group the causes identified during the
brainstorming into logical groupings to represent the Cause & Effect
relationship.
·
Drill Down all the causes for further reasons
and goon extending the branches till the root cause is identified (May use
5-Why technique as required)
Five – Why
Analysis: 5-Why is a
problem solving technique that allows us to reach the root cause by repeatedly
asking the questions. Even though this technique is called “5-Why” we may reach
the root cause with fewer or more than five questions. Use this technique
·
Repetitive
issue without any supporting data
·
Simple
and low risk problems that does not require significant analysis
·
Problem
is very specific to a process/ system (Not spread to multiple processes)
Steps:
·
Define
the problem
·
Gather
the team and confirm the problem
·
Ask
the first Question Why? Record all the answers on a whiteboard or flipchart
·
Ask
few more successive “Why” until we reach no further causes
·
Confirm
the root cause and proceed for next set of actions
Example: Customer complaints on the delay in Pizza delivery
·
Why there is a delay
in the Pizza delivery?
o Delivery boy not reached on time
·
Why the delivery boy
not reached on time?
o He could not find the address
·
Why he could not find
the address?
o Address given to him is incorrect
·
Why the address is
incorrect?
o Address is not available in the records
·
Why the address is
not available in the records?
o Customer is new, manually note down the address
·
Why the address is
incorrect?
o Incorrectly noted while taking orders
Solution: Incase of the first
time users, confirm the address once again and provide the telephone numbers to
the delivery boy to reach out to the customer in case of any issues.
Brainstorming: One
of the very widely used and easy to use techniques for analyzing the problem to
reach the root causes. Brainstorming generates ideas and later evaluated to finalize
and confirm the causes.
Steps:
·
Establish
a clear objective, Re-phrase for confirmation
·
Create
a list of questions
·
Document
all the findings and agree on the same
Labels:
Consulting,
Green Belt,
Improvements,
Lean,
RCA,
Six Sigma,
Statistics
Friday, June 27, 2014
Six Sigma – Improvement Approaches
In Six Sigma program
there are multiple approaches that can be applied or used depending on the
opportunity/problem being addressed. Below approached are majorly used either
in solo or in combination in the six sigma program.
·
Lean
·
PDCA
·
Six Sigma – DMAC
·
Six Sigma – DFSS
Below table shows the high level details about the approaches.
Differences between Lean and Six Sigma: There are many similarities between
Lean and Six Sigma with respect to the approach/objectives. Below tables shows
few differences between the two approaches and suggested technique is a blend
of both again depending on the problem/opportunity in hand.
Tuesday, June 24, 2014
Analytics – Lead Time Prediction
Below approach can be used to
predict the lead time of completing a project considering the variation and
cycle time distribution from the past data. The results are interpreted
considering the probability of interest.
Steps to predict the Lead Time:
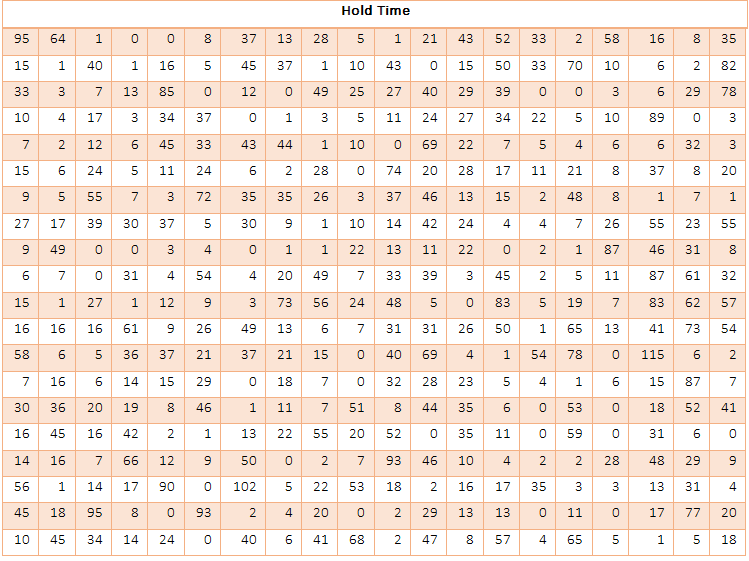
- Collect the data from past related to cycle time and data may include the sub divisions i.e., cycle time may include the actual cycle time, hold time, cycle time of multiple steps etc.,
o
E.g., Project of setting up a new server may
include purchase, installation steps. While gathering the data we can collect
the data at the desired level to capture the uncertainty in each steps while
predicting.
- Understand the distribution of the data
- Calculate the Lead cycle time for multiple probabilities considering the distribution data is following. For this example we are considering that the data is following Normal Distribution. We can use Excel Function NORM.INV (probability, mean, standard_dev) to calculate the Lead time (Predicted) for the project considering different probabilities
- Another way of predicting the lead cycle time is through simulation. Assuming normal distribution generate the normal variables
o
Cycle Time : Mean (31) and Standard deviation (17)
o
Hold Time : Mean (23) and Standard deviation
(24)
o
Add up to get the Total Cycle time = Cycle Time
+ Hold Time
- From this you can interpret that 90% probability cycle time = 103 days
- Probability to complete the project in 60 days = 55%
Monday, June 23, 2014
Lean – Tool Box
Below list
contains the list of tools used in Lean
· Value Stream Maps (VSM)
o
Visually map
the flow of production
o
Current and
future state of processes highlighting opportunities of improvement.
o
Exposes
waste in the current processes and provides a roadmap for future state
o
categorizes activities into three segments: value enabling, value
adding and non-value adding
o
Value enabling activities, however, cannot be totally eliminated
from a system
o
focus of this tool is on identifying and eliminating the non-value
added activities in each process step
·
Takt time
o
Takt time is
the rate at which a completed project needs to be finished in order to meet
customer demand
o
This is
the "heartbeat" of the customer
o
Takt =
T/D
§
Where T is
Time available for product/service.
§
D is a
demand for the number of units
§
T gives
information on production pace or units per hours
·
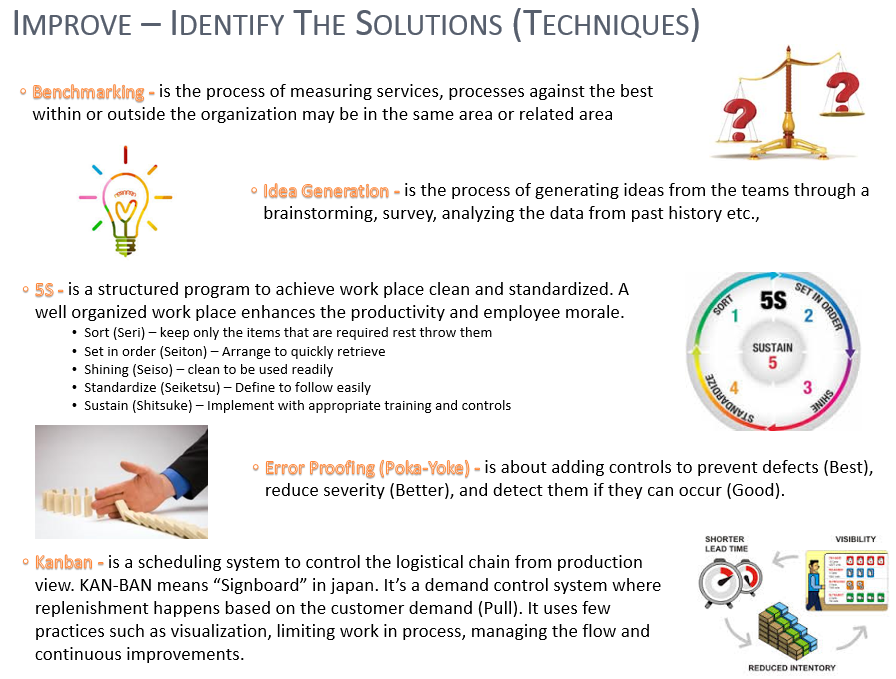
5S
o
Used to
organize the work area and eliminates the waste that results from poorly
organized work area.
§
Sort –
Eliminate that items that are needed
§
Set in order
– Organize the items that are needed
§
Shine –
clean the items
§
Standardize
– defined standard operating procedures
§
Sustain –
Regular compliance and improvement with respect to standards
·
Pull / Kanban
o
Regulating
the flow of goods using the signal cards as needed
o
Eliminates
inventory and overproduction
·
Spaghetti chart
o
Graphical
technique used mostly in lean manufacturing
o
Used to
display the actual flow/layout/material/machines and distances in a work
process
o
Poorly laid
out process work area that looks like a mass of cooked spaghetti
o
Used to
track work item flow, material flow and people flow
·
·
Poka – Yoke
o
Design the
process to detect, fix and prevent the defects as and when it happens
o
Cost of
fixing the defects increases exponentially as the work progresses and the
defects found in later stages than where they got injected
o
Also called
mistake proofing
·
SMED Single Minute Exchange of Die
o
Reduces the
time to Set up
o
Converting
the setup steps to external and simplifying the internal steps
o
Eliminating
non-essential steps and standardizing the work instructions
·
Total Productive Maintenance
o
A holistic
approach focuses on proactive and preventative
o
Empowering
operators to help maintain their equipment.
o
Shared
responsibility for equipment by plant floor workers
·
Heijunka
o
Production
scheduling that purposely manufactures in much smaller batches
o
System of
production designed to provide a more even and consistent flow of work
o
Reduces lead
times and inventory
·
Gemba
o
It’s a
philosophy that encourages to go to the work area and observe for any
opportunities than sitting in the closed cabins
o
Promotes
fist hand observations from the floor employees
·
Hoshin Kanri
o
Align
strategy (Top management) to tactics (middle management) to Actions (employees)
o
Continuity
towards goals by eliminating poor communication & improper direction
·
Jidoka
o
Design the
equipment’s to automate some part of the manufacturing process i.e. partial
automation is less costlier than full automation
o
Mainly focus
on avoiding/detecting and fixing defects quickly
·
Just in time (JIT)
o
Pull the
parts based on the customer demand instead of pushing the parts based on the
projections
o
Reduced the
inventory levels and reduces the space requirements
·
Kaizen
o
Regular and
incremental improvements
Subscribe to:
Posts (Atom)