Showing posts with label Consulting. Show all posts
Saturday, November 22, 2014
Saturday, November 8, 2014
Wednesday, August 6, 2014
SLA Prediction Model
Service Level Agreements (SLA) with the
customer is common in most of the service operations. SLA’s might vary
depending on the business need and many a times the Non Compliance to SLA’s
might lead to huge penalties as well as customer dissatisfaction.
This topic provides an approach for
predicting the SLA compliance in advance and helps in effectively managing the
SLA to avoid noncompliance as well as penalties. This is just an approach the
model can be adjusted based on the business rules, past trends, SLA compliance
parameters etc.
Scenario:
The team resolves the incident tickets received from the customer/automated
tools. The project has a committed SLA with the customer on the “Time to
Resolve the Issue”. And this Time to Resolve SLA is different for different
severity of the tickets. Each issue reported is associated with a knowledge
article that is been referred by the analyst to resolve the issue.
Model Approach:
·
Understand the SLA commitments
o
Time To Resolve – Time it took to
resolve the issue reported from the issue received i.e., Time To Resolve =
Issue resolved time – Issue reported time
o
SLA for Time Resolve
§
Severity 3 – 240 Minutes
·
Assess the parameters that might affect
the SLA
o
Parameters that might impact the Time To
Resolve includes
§
Severity
§
Issue type
§
Shift
§
Week Day/ Week End
§
KB Article
·
Analyze the issue categories
o
By Problem type
o
By KB article
·
Gather the data for the past 3-6 months
(Depending on the volume and issues coverage)
o
Below is the sample data captured for the Time To Resolve
SLA
·
Understand the Time To Resolve
distribution with respect to the above parameters as highlighted in second
bullet
o
Time To Resolve
§
Distribution with respect to
·
Confirm the parameters that are
impacting the Time To Resolve
o
Time To Resolve
§
Above table as observed there is a
significant variation in the distribution from Morning shift to Night shift
§
Confirmed parameters include
·
Issue Type
·
Shift
·
Baseline the Time To Resolve
distribution with respect to the above parameters
o
Time To Resolve – Baselines
·
Develop the Model to be referred/used
for predicting the SLA compliance. This can be customized based on the business
need
Tuesday, August 5, 2014
Consulting – Introduction to ITIL
Introduction:
•
Information Technology Infrastructure
Library
•
Global standard that has been in use for
over 20 years
•
Collection of best practices to optimize
the services
•
Started in 80s
•
v2 came along in
2000-2002
– Still Large and complex (8 Books)
– Talks about what you should do
•
v3 in 2007
– Much simplified and rationalized (5 books)
– Much clearer guidance & easier
– Aligned with ISO20000
Monday, August 4, 2014
Six Sigma - Project Charter
Project Charter is the first deliverable in
the entire six sigma project journey and is part of the Define phase. This
contains the information about the problem/ opportunity to the objective and
timelines. There are many templates available in the industry on the project
charter. Whatever is the template below contents are necessary to be part of
the project charter.
Main
components of the “project charter” includes
·
Problem Statement – context of the process to which the
problem/opportunity associated, Intensity of the problem, what should be the
impact if not addressed.
·
Business Case – contains the business context of the problem,
impact, need and urgency.
·
Scope – Boundary and interfaces of the problem/opportunity
·
Purpose – What is that being achieved at the end of this
project
·
Objective (CTQ) – Critical to Quality parameters being
measured, baseline and improved.
·
Team composition – Team and their roles
·
Benefits – Benefits achieved at the end of the project,
benefits could be Hard/Soft.
Heat Map - Visual Representation
Heat
map is one of the useful and powerful data-analysis tools available in
business intelligence. Heat Map is visual representation of data using
colors instead of numbers only. This tool is used to analyze the complex data
sets for a quick and easy way of understanding.
Popular heat maps being referred/used in the
industry includes
- Election results by geography
- Visitors interaction with a webpage
- Usability or consumer experience
There are many
ways to create heat maps but the common understanding in all of these
representation is usage of colors to communicate the numbers and their
relationships. Heat Maps are mostly used for two
dimensional representation. But the advanced heat maps can be drawn for more
than two dimensions. For example cell size and color both can be used to
represent a different relationships. One can add sliders to filter/zoom the
data and its relationships as required by the user. If you have to represent the
same situation using a bar chart, the visual would be cluttered and difficult
to understand.
Example:
Below heat map
used to understand the customer feedback from a service operations. Customer provided
his feedback with the services offered by the vendor. Feedback can be positive
(Happy with the service provided) or negative (Not happy with the services). Purpose
of this heat map is to understand the customer view of the services provided
with appropriate filters and drill-downs.
Quality Function Deployment
- Gather Voice of Customer (VOC)
- Rate the requirements on a scale of 1-5
- Understand competitors ratings with respect to ours
- Identify/map technical parameters that influences requirements
- Build the correlation among requirements & technical parameters.
- Also relation among technical parameters
- Analyze the matrix to understand
- Complete the QFD Matrix
Monday, July 28, 2014
Consulting – Taguchi’s Loss function
Myth: Any outcome
between the customer specification limits considered as equal form the customer
perspective. For example customer queue time in a bank is between 15-30minutes,
as per this myth the customer who is been served at 15 minutes and another
customer at 30minutes is received the same quality from the bank perspective as
both of them are service within the agree time.
Reality: The
quality of service/ product will be of not equal from the customer/ society
perspective as it goes away from the target value even though it is within the
agreed specification limits.
Justification:
Taguchi one of the well-known statistician / engineer developed a
representation that measures the financial impact of loss to the society if the
product/service deviates from the target value. The representation is termed as
Taguchi’s Loss Function. In conventional methods the Cost of Quality is
measured considering the number of products rejected or reworked. In this
method it is difficult to differentiate the cost of quality if the two products
properties are within the specification limits but vary from each other.
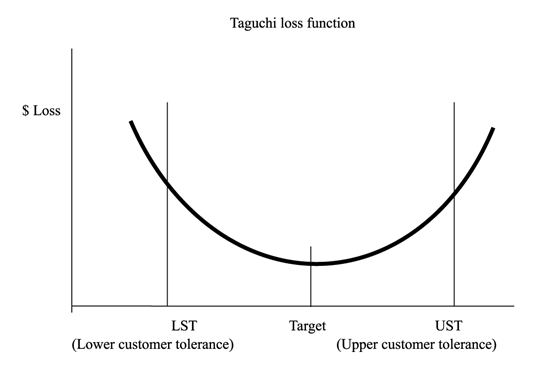
From Taguchi’s perspective the loss function is as below.
The graph depicts the lross function as a deviation from the target value of a
product parameter. The parameter could be a diameter, color, density, hardness
any other critical parameter of a product. From the service perspective the
parameter could be cycle time, communication, responsiveness etc.
UST – Upper Specification Tolerance, LST – Lower
Specification Tolerance
Taguchi believes performance begins decreasing gradually as
the design parameter deviates from the target value even though the parameter
value is between the LST and UST. Therefore, Taguchi proposed that the
loss function be measured by the deviation from the target value. The loss
function is
L = K * (Y – M) ^ 2
·
L is the result value of the function, generally
measured in monetary units
·
Y measured value
·
M target value
·
K is a loss coefficient (Convert into monetary
values)
Example: A company produces a part that has a diameter of 0.5
inches + or - 0.01 inches of tolerance. Failure cost of a rejection is $45.00.
There are 30 units produced and the actual diameter is as below. Calculate and
compare the loss considering the convention method as well as Taguchi’s loss
function method.
Monday, June 30, 2014
Six Sigma – Root Cause Analysis (RCA)
Introduction: Beneath
every problem there is an underlying cause but we need to identify the root
cause to prevent the recurrence. Many times the actions taken to address the
issue reoccur again in the same place or in a different place. This symptom indicates
that the root cause is not been identified/addressed. Root Cause Analysis (RCA)
is a structured approach for identifying and eliminating the underlying root
causes. It may not be feasible or necessary to conduct RCA for all the issues
as it involves time and effort. RCA is an analytical tool to perform a
comprehensive, system-based review of critical incidents. Primary objectives of
RCA includes
·
The
primary aim is to identify the root cause(s) and prevent that problem from ever
recurring
·
Systematic
way of approaching and resolving the problem
·
Prevent
the recurrence at lowest cost in the simplest way
- Define the
problem
- Gather the
information
- Plan for
Root Cause Analysis
- Conduct RCA
- Develop the
solutions and action plans
- Manage the
Action items
Labels:
Consulting,
Green Belt,
Improvements,
Lean,
RCA,
Six Sigma,
Statistics
Six Sigma – Root Cause Analysis Techniques
Many techniques available in conducting Root
Cause Analysis, each technique has its own advantages and suitable for a
particular situation. Common, widely accepted and simple to use techniques
includes
·
Cause & Effect diagram
·
5-Why Analysis
·
Brainstorming
Cause &
Effect Diagram: Also
called as Fishbone diagram. This is a tool for identifying all the causes of an
effect. The effect being examined is the problem/opportunity that has to be
eliminated. C&E Diagram is a graphical representation of the causes and
effect. Use this technique for
·
Multiple causes has to be grouped logically
·
Understand width and depth of the causes
·
Problem is repetitive
Steps:
·
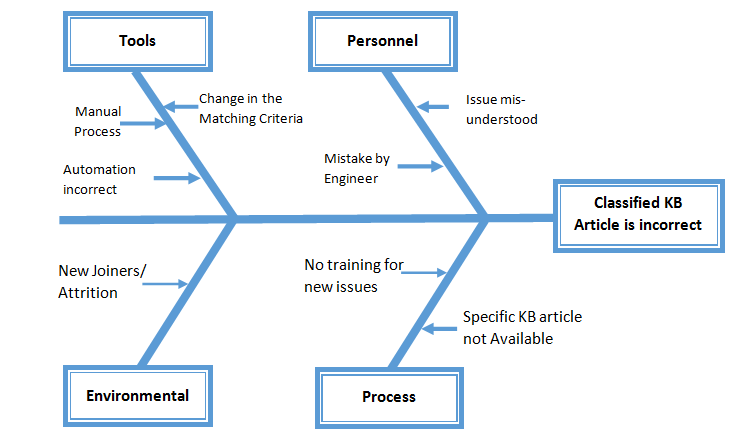
Write down the effect to be investigated and
draw the backbone arrow (as below)
Note: KB Article – Knowledge Base Article
has to be selected by the engineer to resolve an issue reported by the
customer. Selecting of wrong article either delays the resolution or
unnecessary escalation to a next level as the issue is unresolved by the engineer.
· Brainstorm with the identified people
considering all the broad areas/ groupings of the potential causes of the
effect “Classified KB article is incorrect”. Rule of thumb consider the generic
4 categories i.e., Man, Method, Material and Environment. You can define your
own categories and may use affinity diagram to group the cause.
·
Group the causes identified during the
brainstorming into logical groupings to represent the Cause & Effect
relationship.
·
Drill Down all the causes for further reasons
and goon extending the branches till the root cause is identified (May use
5-Why technique as required)
Five – Why
Analysis: 5-Why is a
problem solving technique that allows us to reach the root cause by repeatedly
asking the questions. Even though this technique is called “5-Why” we may reach
the root cause with fewer or more than five questions. Use this technique
·
Repetitive
issue without any supporting data
·
Simple
and low risk problems that does not require significant analysis
·
Problem
is very specific to a process/ system (Not spread to multiple processes)
Steps:
·
Define
the problem
·
Gather
the team and confirm the problem
·
Ask
the first Question Why? Record all the answers on a whiteboard or flipchart
·
Ask
few more successive “Why” until we reach no further causes
·
Confirm
the root cause and proceed for next set of actions
Example: Customer complaints on the delay in Pizza delivery
·
Why there is a delay
in the Pizza delivery?
o Delivery boy not reached on time
·
Why the delivery boy
not reached on time?
o He could not find the address
·
Why he could not find
the address?
o Address given to him is incorrect
·
Why the address is
incorrect?
o Address is not available in the records
·
Why the address is
not available in the records?
o Customer is new, manually note down the address
·
Why the address is
incorrect?
o Incorrectly noted while taking orders
Solution: Incase of the first
time users, confirm the address once again and provide the telephone numbers to
the delivery boy to reach out to the customer in case of any issues.
Brainstorming: One
of the very widely used and easy to use techniques for analyzing the problem to
reach the root causes. Brainstorming generates ideas and later evaluated to finalize
and confirm the causes.
Steps:
·
Establish
a clear objective, Re-phrase for confirmation
·
Create
a list of questions
·
Document
all the findings and agree on the same
Labels:
Consulting,
Green Belt,
Improvements,
Lean,
RCA,
Six Sigma,
Statistics
Subscribe to:
Posts (Atom)