Showing posts with label Six Sigma. Show all posts

Saturday, November 8, 2014

Notes from Ideas Book - Phase 5 Enacting Ideas

Notes from "Ideas book"

Fifth and last phase is "Enacting Ideas", Below are few inputs on preparation


Notes from Ideas book - Phase 4 Judging the ideas

Notes from "Ideas book"

Fourth phase is "Judging the Ideas", Below are few inputs on preparation


Notes from Ideas Book - Phase 3 Developing and Understanding Ideas

Notes from "Ideas book"

Third phase is "Developing and Understanding", Below are few inputs on preparation


Notes from Ideas book - Phase 2 Generating Ideas

Notes from "Ideas book"

Second phase is "Generating Ideas", Below are few inputs on preparation


Notes from Ideas Book - Phase 1 Preparing for Idea generation

Notes from "Ideas book"

First phase is "Preparing for Idea Generation", Below are few inputs on preparation


Wednesday, August 6, 2014

Six Sigma – Measurement System Analysis

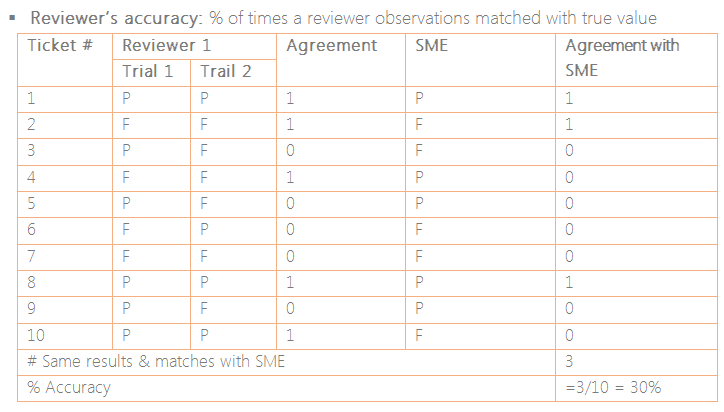
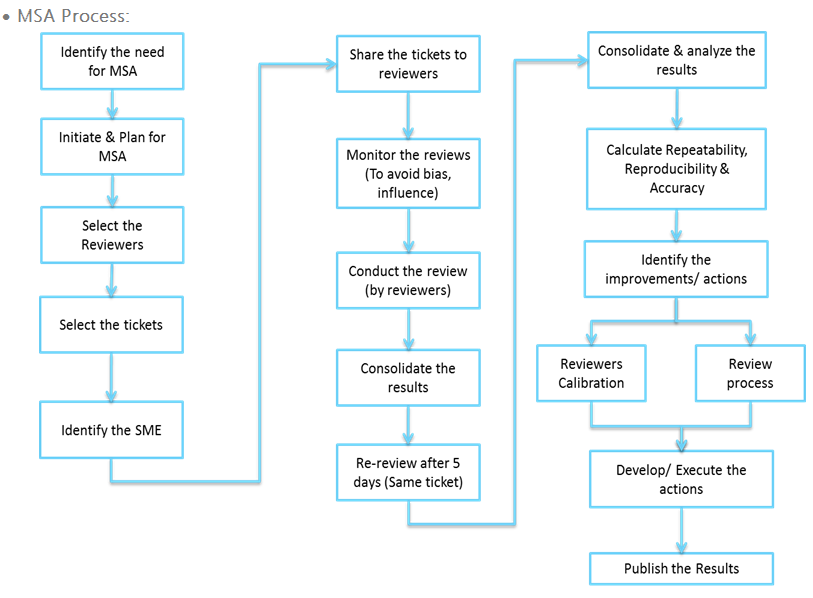
Context: In this scenario the incident tickets were reviewed by the selected and trained reviewers with respect to a predefined parameters.  The main objective is to understand the accuracy as well as the consistency among the reviewers before confirming the review results followed by appropriate actions.


Review results are the output of the review measurement process carried out by
v  Reviewers, Checklist, Environment, Review method, Data collection/capturing

Components of MSA Process:
·   Key Considerations:
§  The study should be performed over the range (Severities, Shifts, Reviewers, Towers etc.,)
§  Actual Checklist should be used, already written review procedures should be followed
§  It should be business as usual
§  Measurement variability should be presented “as-is”, not as it was designed to be
·   Data Collection:
§  Select15 reviewers and 10 tickets to be evaluated
§  Appropriate sampling techniques should be used
§  Each ticket is to be reviewed 2 times by each reviewer with a gap of sometime (e.g. a week)
§  Analyze the data to verify the repeatability, reproducibility and accuracy
·   Frequency:
§  Once in a quarter
§  Addition of new reviewers in to the system
§  Changes to review checklists, Changes to the current process being evaluated
§  Missing correlation with other sources like customer feedback etc.,


SLA Prediction Model

Service Level Agreements (SLA) with the customer is common in most of the service operations. SLA’s might vary depending on the business need and many a times the Non Compliance to SLA’s might lead to huge penalties as well as customer dissatisfaction.
This topic provides an approach for predicting the SLA compliance in advance and helps in effectively managing the SLA to avoid noncompliance as well as penalties. This is just an approach the model can be adjusted based on the business rules, past trends, SLA compliance parameters etc.
Scenario: The team resolves the incident tickets received from the customer/automated tools. The project has a committed SLA with the customer on the “Time to Resolve the Issue”. And this Time to Resolve SLA is different for different severity of the tickets. Each issue reported is associated with a knowledge article that is been referred by the analyst to resolve the issue.
Model Approach:
·        Understand the SLA commitments
o   Time To Resolve – Time it took to resolve the issue reported from the issue received i.e., Time To Resolve = Issue resolved time – Issue reported time
o   SLA for Time Resolve
§  Severity 3 – 240 Minutes

·        Assess the parameters that might affect the SLA
o   Parameters that might impact the Time To Resolve includes
§  Severity
§  Issue type
§  Shift
§  Week Day/ Week End
§  KB Article
·        Analyze the issue categories
o   By Problem type
o   By KB article

·        Gather the data for the past 3-6 months (Depending on the volume and issues coverage)

o   Below is the  sample data captured for the Time To Resolve SLA
·        Understand the Time To Resolve distribution with respect to the above parameters as highlighted in second bullet
o   Time To Resolve
§  Distribution with respect to


·        Confirm the parameters that are impacting the Time To Resolve
o   Time To Resolve
§  Above table as observed there is a significant variation in the distribution from Morning shift to Night shift
§  Confirmed parameters include
·        Issue Type
·        Shift
·        Baseline the Time To Resolve distribution with respect to the above parameters
o   Time To Resolve – Baselines


·        Develop the Model to be referred/used for predicting the SLA compliance. This can be customized based on the business need


Monday, August 4, 2014

Six Sigma - Project Charter


Project Charter is the first deliverable in the entire six sigma project journey and is part of the Define phase. This contains the information about the problem/ opportunity to the objective and timelines. There are many templates available in the industry on the project charter. Whatever is the template below contents are necessary to be part of the project charter.


Main components of the “project charter” includes
·        Problem Statement – context of the process to which the problem/opportunity associated, Intensity of the problem, what should be the impact if not addressed.
·        Business Case – contains the business context of the problem, impact, need and urgency.
·        Scope – Boundary and interfaces of the problem/opportunity
·        Purpose – What is that being achieved at the end of this project
·        Objective (CTQ) – Critical to Quality parameters being measured, baseline and improved.
·        Team composition – Team and their roles
·        Benefits – Benefits achieved at the end of the project, benefits could be Hard/Soft.
·        Timelines – Major phases and their scheduled completion dates

Heat Map - Visual Representation


Heat map is one of the useful and powerful data-analysis tools available in business intelligence. Heat Map is visual representation of data using colors instead of numbers only. This tool is used to analyze the complex data sets for a quick and easy way of understanding.
Popular heat maps being referred/used in the industry includes
  • Election results by geography
  • Visitors interaction with a webpage
  • Usability or consumer experience

There are many ways to create heat maps but the common understanding in all of these representation is usage of colors to communicate the numbers and their relationships. Heat Maps are mostly used for two dimensional representation. But the advanced heat maps can be drawn for more than two dimensions. For example cell size and color both can be used to represent a different relationships. One can add sliders to filter/zoom the data and its relationships as required by the user. If you have to represent the same situation using a bar chart, the visual would be cluttered and difficult to understand.

Example:

Below heat map used to understand the customer feedback from a service operations. Customer provided his feedback with the services offered by the vendor. Feedback can be positive (Happy with the service provided) or negative (Not happy with the services). Purpose of this heat map is to understand the customer view of the services provided with appropriate filters and drill-downs.


Quality Function Deployment


  •       Gather Voice of Customer (VOC)
  •         Rate the requirements on a scale of 1-5
  •         Understand competitors ratings with respect to ours
  •         Identify/map technical parameters that influences requirements
  •         Build the correlation among requirements & technical parameters.
  •         Also relation among technical parameters
  •         Analyze the matrix to understand
  •         Complete the QFD Matrix


Monday, July 28, 2014

Sources of Variation

Sources of variation can be categorized into two major categories. These are called common cause variation and special cause variation.
Common Cause Variation:
·        Present all the times in the process
·        Individually will have a minor effect
·        Collectively the variation can be added up leading to significant effect
Special Cause Variation:
·        Not always present in the process
·        Appear sporadically
·        Come from outside the process
·        Can have large or small affect on variation but typically have major impact

Strategy to address special cause:
·        Gather the data real time to signal the special causes quickly
·        Take immediate actions to reduce the damage
·        Investigate for the cause – Understand what is different
·        Plan for a long term solution
Strategies to address the common causes involves
·        Stratify – Identify the patterns in the way the data is clustered or do not clustered
·        Experiment – Make planned changes and learn from the effect
·        Disaggregate – Break the processes into small pieces and manage the pieces effectively

7 Step method of process improvement:
1.      Purpose
·         What are we trying to do?
·        What problem/gap is being addressed?
·        What is the impact?
·        What are the other reasons to fix this gap?
·        How to know things are better once improved?
·        What is your plan for this project?
2.      Current Situation
·        What is the history?
·        What are the symptoms of the problem?
·        Where do they appear?
·        What happens when the problem occurs?
·        Who is involved?
·        Can we draw the flowchart to depict the process?
3.      Cause Analysis
·        What are the causes for the symptoms?
·        Which can be verified using data?
·        What are the potential root causes?
4.      Solutions
·        What actions will address the root causes?
·        What criteria can be used to compare the solutions?
·        What are the pros and cons of each solution?
·        Which is the best? Which one will be selected?
·        How to test in a small scale? How to verify with data?
·        Which solution proved to be more effective?
·        What are the plans for full scale implementation?
5.      Results
·        How will the results meet the targets?
·        How well the plan executed?
·        How the results can be sustained in future?
6.      Standardization
·        What is the new standard method?
·        How will the users be trained?
·        What is in place to ensure the results are maintained?
·        How the results will be monitored?
·        What means are in place to foster ongoing improvements?
7.      Future plans
·        What is not addressed by this project?
·        What are the recommendations?
·        What is being learned from the project?
·        How the documentation will be finished?
·        What is the exit criterion to close the project?
·        Did we meet the exit criteria?