
Below approach can be used to
predict the lead time of completing a project considering the variation and
cycle time distribution from the past data. The results are interpreted
considering the probability of interest.
Steps to predict the Lead Time:
- Collect the data from past related to cycle time and data may include the sub divisions i.e., cycle time may include the actual cycle time, hold time, cycle time of multiple steps etc.,
o
E.g., Project of setting up a new server may
include purchase, installation steps. While gathering the data we can collect
the data at the desired level to capture the uncertainty in each steps while
predicting.

- Understand the distribution of the data

- Calculate the Lead cycle time for multiple probabilities considering the distribution data is following. For this example we are considering that the data is following Normal Distribution. We can use Excel Function NORM.INV (probability, mean, standard_dev) to calculate the Lead time (Predicted) for the project considering different probabilities

- Another way of predicting the lead cycle time is through simulation. Assuming normal distribution generate the normal variables
o
Cycle Time : Mean (31) and Standard deviation (17)
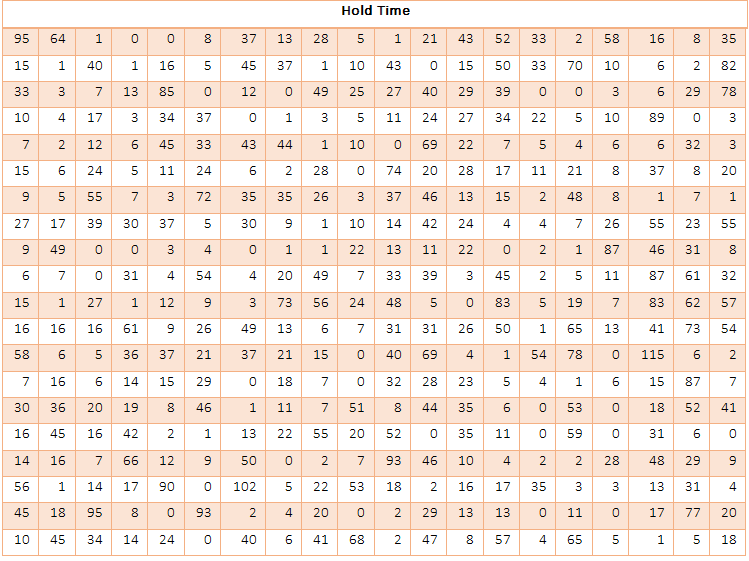
o
Hold Time : Mean (23) and Standard deviation
(24)
o
Add up to get the Total Cycle time = Cycle Time
+ Hold Time

- From this you can interpret that 90% probability cycle time = 103 days
- Probability to complete the project in 60 days = 55%
Well explained how predict the Lead Time. Thanks Sridhar
ReplyDelete