
Box Plots are used for multiple purposes and few of them are below
- To Visualize Mean and Variation
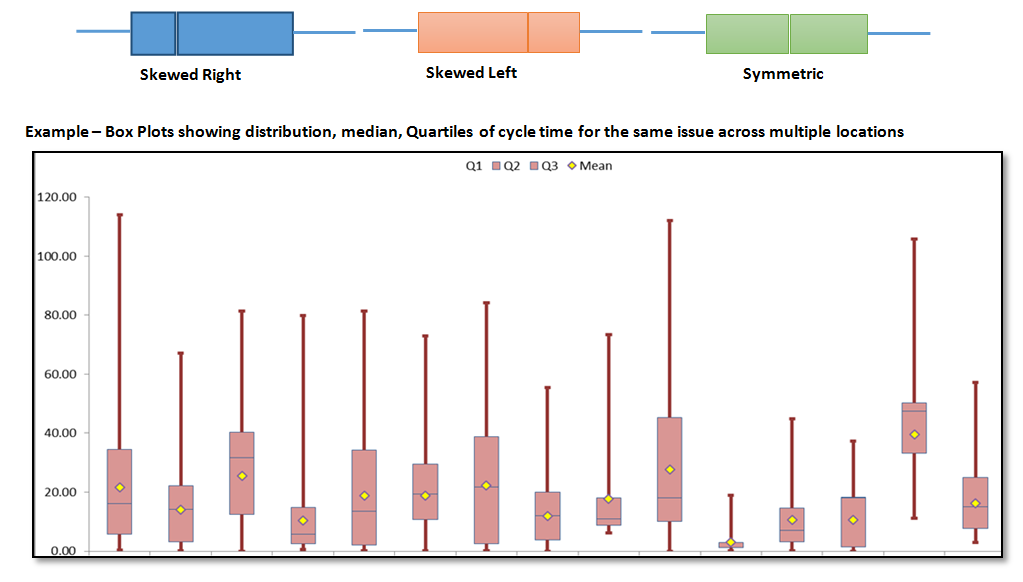
- To compare the same metric across the locations, applications, engineers etc.
- To Identify the outliers in case any
- To compare the distributions
Box Plots are sometimes referred
as Box and Whisker plots. These types of graphs are used to display the range, median
and quartiles. When they are completed, a box contains the first and
third quartiles. Whiskers extend from the box to the minimum and
maximum values of the data.
There are several steps in
constructing a box plot. The first relies on the 25th, 50th,
and 75th percentiles in the distribution of scores. The 50th
percentile is drawn inside the box. Therefore, the bottom of each box is the
25th percentile, the top is the 75th percentile, and the line in the
middle is the 50th percentile.

How to read the box plots:
- Median is indicated by the vertical line that runs down the center of the box
- Display two common measures of the variability or spread in a data set
- Range, Interquartile Range
- Shape of the data
No comments:
Post a Comment