Monday, June 23, 2014

Lean – Tool Box

Below list contains the list of tools used in Lean

·      Value Stream Maps (VSM)
o   Visually map the flow of production
o   Current and future state of processes highlighting opportunities of improvement.
o   Exposes waste in the current processes and provides a roadmap for future state
o   categorizes activities into three segments: value enabling, value adding and non-value adding
o   Value enabling activities, however, cannot be totally eliminated from a system
o   focus of this tool is on identifying and eliminating the non-value added activities in each process step

·        Takt time
o   Takt time is the rate at which a completed project needs to be finished in order to meet customer demand
o   This is the "heartbeat" of the customer
o   Takt = T/D    
§  Where T is Time available for product/service.
§  D is a demand for the number of units
§  T gives information on production pace or units per hours

·        5S
o   Used to organize the work area and eliminates the waste that results from poorly organized work area.
§  Sort – Eliminate that items that are needed
§  Set in order – Organize the items that are needed
§  Shine – clean the items
§  Standardize – defined standard operating procedures
§  Sustain – Regular compliance and improvement with respect to standards

·        Pull / Kanban
o   Regulating the flow of goods using the signal cards as needed
o   Eliminates inventory and overproduction

·        Spaghetti chart
o   Graphical technique used mostly in lean manufacturing
o   Used to display the actual flow/layout/material/machines and distances in a work process
o   Poorly laid out process work area that looks like a mass of cooked spaghetti
o   Used to track work item flow, material flow and people flow

·         
·        Poka – Yoke
o   Design the process to detect, fix and prevent the defects as and when it happens
o   Cost of fixing the defects increases exponentially as the work progresses and the defects found in later stages than where they got injected
o   Also called mistake proofing

·        SMED Single Minute Exchange of Die
o   Reduces the time to Set up
o   Converting the setup steps to external and simplifying the internal steps
o   Eliminating non-essential steps and standardizing the work instructions

·        Total Productive Maintenance
o   A holistic approach focuses on proactive and preventative
o   Empowering operators to help maintain their equipment.
o   Shared responsibility for equipment by plant floor workers

·        Heijunka
o   Production scheduling that purposely manufactures in much smaller batches
o   System of production designed to provide a more even and consistent flow of work
o   Reduces lead times and inventory

·        Gemba
o   It’s a philosophy that encourages to go to the work area and observe for any opportunities than sitting in the closed cabins
o   Promotes fist hand observations from the floor employees

·        Hoshin Kanri
o   Align strategy (Top management) to tactics (middle management) to Actions (employees)
o   Continuity towards goals by eliminating poor communication & improper direction

·        Jidoka
o   Design the equipment’s to automate some part of the manufacturing process i.e. partial automation is less costlier than full automation
o   Mainly focus on avoiding/detecting and fixing defects quickly

·        Just in time (JIT)
o   Pull the parts based on the customer demand instead of pushing the parts based on the projections
o   Reduced the inventory levels and reduces the space requirements

·        Kaizen
o   Regular and incremental improvements

o   Participation from all the employees

Friday, June 20, 2014

Six Sigma – Box Plots

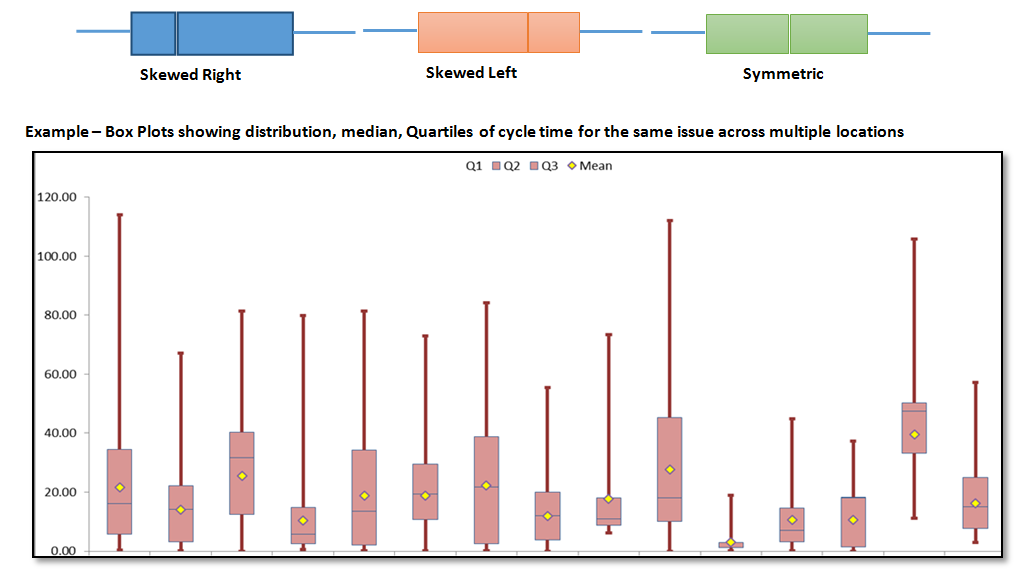
Box Plots are used for multiple purposes and few of them are below
  • To Visualize Mean and Variation
  • To compare the same metric across the locations, applications, engineers etc.
  • To Identify the outliers in case any
  • To compare the distributions

Box Plots are sometimes referred as Box and Whisker plots. These types of graphs are used to display the range, median and quartiles. When they are completed, a box contains the first and third quartiles. Whiskers extend from the box to the minimum and maximum values of the data.

There are several steps in constructing a box plot. The first relies on the 25th, 50th, and 75th percentiles in the distribution of scores. The 50th percentile is drawn inside the box. Therefore, the bottom of each box is the 25th percentile, the top is the 75th percentile, and the line in the middle is the 50th percentile.


How to read the box plots:
  • Median is indicated by the vertical line that runs down the center of the box
  • Display two common measures of the variability or spread in a data set
    • Range, Interquartile Range
  • Shape of the data

Six Sigma – Quadrant Analysis

This approach used to prioritize the appropriate areas that are to be focused based on the identified criteria. This technique is recommended when you have many items and you have to prioritize few based on multiple criteria.
The example being used here includes a set of issue categories being resolved by the team. Team needs to prioritize the issues to be focused based on the below criteria
·       - Volumes
·       - Average Hold time/ Dependency time
·       - Cycle time
o   Mean
o   Standard deviation

Approach being used is called as Quadrant analysis. In this analysis the data is divided into 4 blocks based on the volume and average hold/dependency time.


From the quadrant analysis the team can prioritize the list of issues to be focused on considering the multiple criteria as identified. This tool can be used in either Analyze/ Improve phases of six sigma projects where the team has to choose few out of many with multiple criteria in hand. Also on the positive side the same can be used to understand the best performers, applications, locations etc.

Thursday, June 19, 2014

Six Sigma – Variant of a Tornado Diagram

Tornado diagram is used for sensitivity analysis i.e., comparing the relative importance of variables. It’s a special type of bar chart where the data categories listed vertically instead of horizontal. The chart visually resembles like a tornado. For each variable you need to estimate the low, base and high outcomes considering the uncertainty involved. This helps in understanding the sensitivity/risk with respect to the associated variables.

Below scenario explains one of the variants of the tornado diagram, this is been applied in the context of sub processes combined into a process and each sub process has varying cycle time and targets. The main ideas for this variant representation is to understand the sub process wise mean cycle time, variation and the targets in a single diagram.

Scenario:
One of the Projects that we get as a part of our service catalog is to configuring new servers for hosting the applications. The entire process of configuring new servers will take around 1-2 months. To configure the new server there are multiple steps including creating a request, assigning a project manager, purchasing the hardware if required, space approvals, capacity review etc.,

Each of these steps needs time that is varying from project to project depending on multiple reasons. There is a need to understand the mean, variation and the targets with respect to cycle time for all the steps of a new server configuration visually in a single diagram.

Variant of Tornado Diagram:

Data is gathered on all the sub process/ steps involved in this project. Data gathered includes cycle time mean, variation and target. 95% of the time the projects have to meet the targets as per the commitment with customer.


Lean Tools - Value Stream Mapping (VSM)


Purpose:
•        Value stream mapping is used to identify the value added / Non value added tasks in a process
•        Value is defined with respect to the end user only
•        Special type of flow chart with additional symbols to represent the waste/ flow / information
•        Overall objective of VSM analysis to reduce the contribution of non-value added activities in the process from the customer point of view
Steps
•        Identify the team and the process to be studied for the VSM
•        Define the process workflow (As is process map) using the predefined symbols used in VSM
•        Calculate the takt time, work time and lead time  (i.e., lead time includes work time + delay)
•        Classify / identify the non-value adds i.e., waste in the process
•        Define the future value stream map (to be process map)
•        Identify the actions necessary to remove/reduce the waste towards future VSM
Tips
•        Value should be always categorized from the end user/ customer point of view only
•        Identify even a small step that can be done while defining the as is process

Example: Below workflow shows the common process followed for resolving a ticket from the issue reported to issue resolved. Even though this process at high level is same but for a few types of issues the end to end cycle time is high. 


Saturday, June 7, 2014

Intro to Normal Probability Plot

Normal Probability Plot:

Normal probability plot is a graphical technique for assessing whether or not a data set is approximately normally distributed. The data are plotted against a theoretical normal distribution in such a way that the points should form an approximate straight line. Departures from this straight line indicate departures from normality.

The normal probability plot is formed by:
•        Vertical axis: Ordered response values
•        Horizontal axis: Normal order statistic medians

The normal probability plot is used to answer the following questions
•        Are the data normally distributed?

•        What is the nature of the departure from normality (data skewed, shorter than expected tails, longer than expected tails)?


Intro to Measurement System Analysis

Measurement System Analysis

Measurements are used to guide decisions, more error in the measurements, more error in the decisions based on those.

•        Purpose of Measurement System Analysis is to
–       Qualify a measurement system for use
–       Quantifying its accuracy, precision, and stability

•        Factors that are affecting measurement system includes
–       Equipment – Measuring instrument, fixtures etc.,
–       People – Operators, training, skill etc.,
–       Process – Method, specification
–       Samples – Sampling plan, sample selection
–       Environment – temperature, humidity

Variation in the process can be of two reasons
·        True Process Variation
·        Variation Due To Measurement
o   Bias - Difference between average of measurements and an agreed upon standard
§  Accuracy - Closeness between the average value to its actual value
§  Linearity - Difference in accuracy across expected range of measurement system
§  Stability - consistency of measurement system over a period of time

o   Precision - Variation in the measures when the same part is measured repeatedly
§  Repeatability - Measures the inherent variation in the instrument
§  Reproducibility – Measures the variation due to measurement system